Health System Needs Survey System with User Driven Reporting
Problem
Health care systems have an ongoing obligation to educate their staff. In an effort to create the best educational experience possible the educational staff at UNM Hospitals collect surveys after each training session. In the late 90’s or early 2000’s their programmers built a venerable system for the task.
But it was showing it’s age, it didn’t work well on modern browsers, especially on mobile devices, and it didn’t have any reporting. So reports were effectively one-off programs or required the use of more complex tools like Tableau.
A few years earlier one of the instructors, with the help of one of the staff programmers, started work on a new system. But after working with two different programmers, the project stalled due to some technical challenges and scope creep.
Solution
Through a series meeting with the stakeholders, their priorities were clearly identified. It became evident that their priority was reporting. The earlier efforts had become focused on editing surveys, a tagging system, and other features. The tagging system was eliminated as well as other features that we came to realize were non-essential. We prioritized and redesigned the existing reporting system.
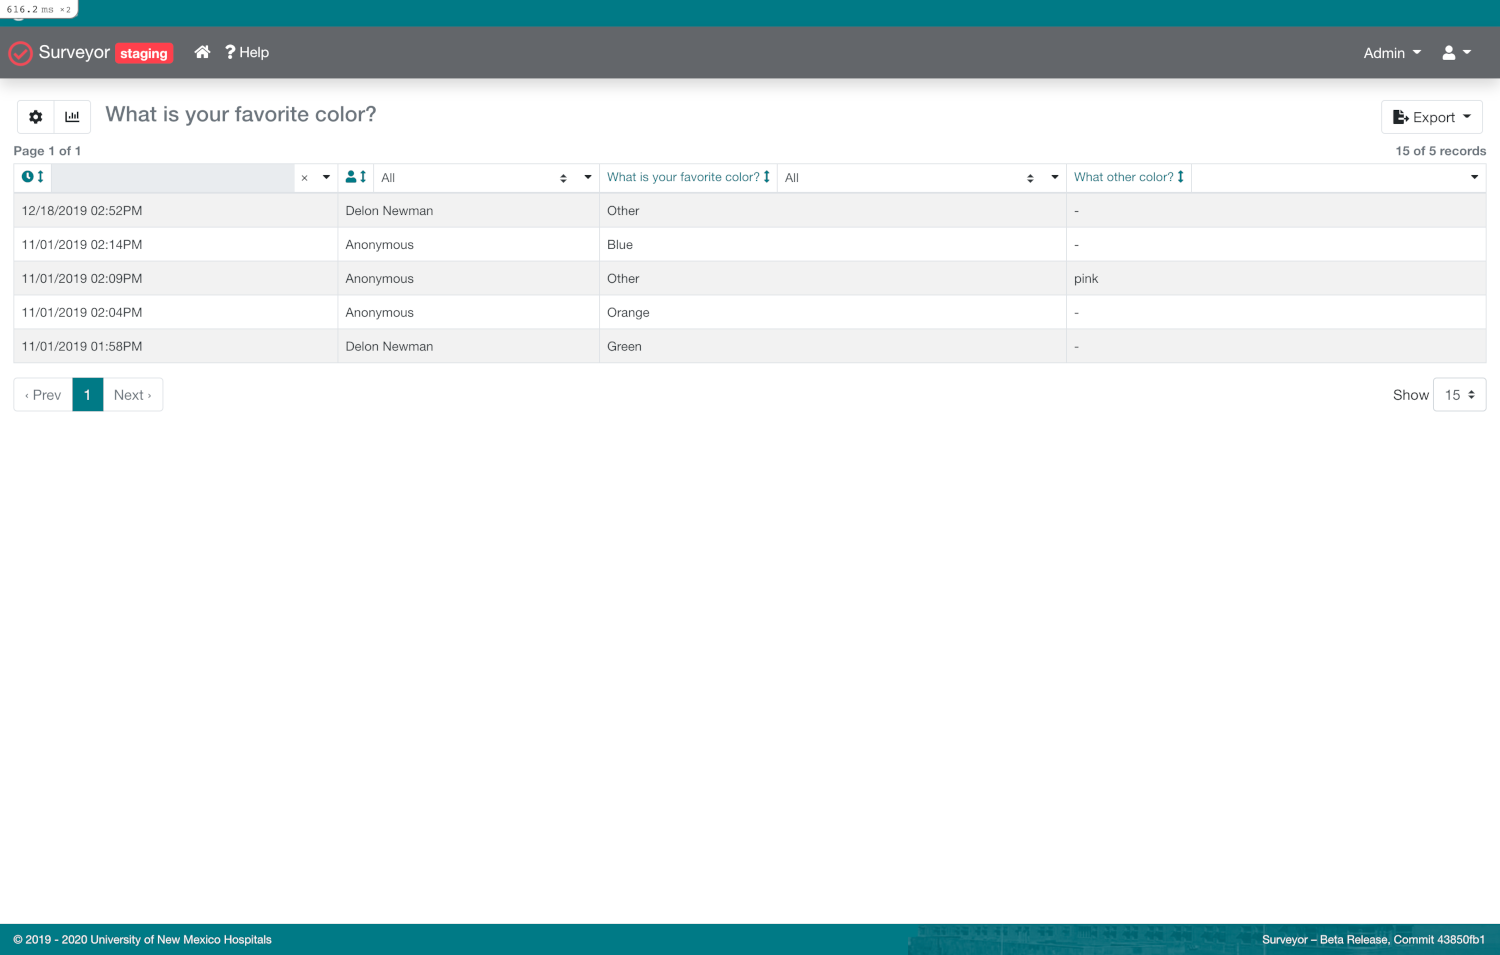
The new reporting system’s design was based on the relational model (think SQL). It presented a tabular view of the data similar to a spreadsheet and allowed the user to filter on any column according to data type and remove columns as they like. Then they could save those reports so they could see up-to-date information in reports that they designed themselves. The data could also be exported into Excel or Tableau for more complex analysis. But more often than not the user defined reports were more than enough.
Redesigning the data model enabled us to automatically generate an analytics dashboard for each survey and report.
The editor also presented some challenges since the users wanted a more modern feel for the application. It was developed as a micro frontend in vanilla JavaScript. It proved to be performant, user-friendly and resposive with an auto-save feature, and drag-and-drop editing.
Ultimately, the system was ready for use within a few months after years of stagnation.